By Catriona Croft-Cusworth, originally published at CIFOR’s Forests News
Wetlands are important ecosystems for climate change mitigation and adaptation because they can store huge amounts of carbon, while providing other essential services. Knowing where carbon is stored helps to identify which areas to conserve and enhance for maximum storage of carbon in the ground, rather than in the atmosphere.
But not enough is known about where wetlands can be found, or how much area they cover, especially in the tropics.
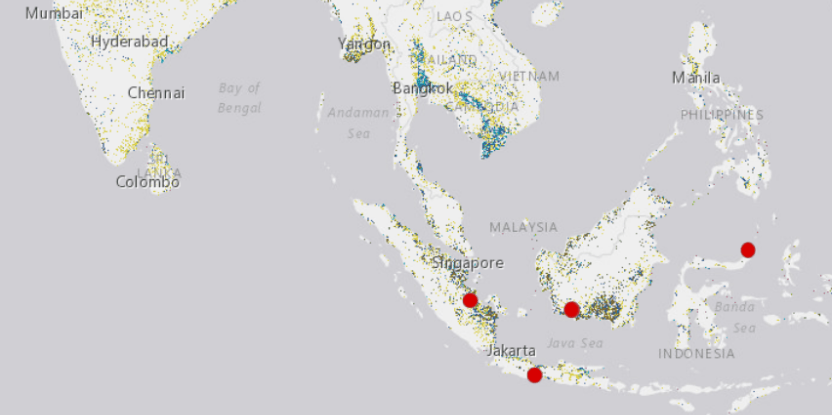
To address this gap, an online, interactive map was launched last month that invites researchers and other experts to help map the world’s wetlands.
The Global Wetlands Map plots the distribution of wetlands, histosols – or peaty soils – and their carbon stocks around the world. Visitors can freely access the data via the online map or by download, while registered users can verify data and add their own.
The new initiative comes from the Sustainable Wetlands Adaptation and Mitigation Program (SWAMP), a collaborative effort between the Center for International Forestry Research (CIFOR) and the United States Forest Service. It was launched last month on the sidelines of the 15th International Peat Congress in Kuching, Malaysia. Further discussion in this area is expected at this week’s meetings of the Blue Carbon Scientific Working Group in Manado, Indonesia.
CIFOR Principal Scientist and Principal Investigator for SWAMP, Daniel Murdiyarso, explains:
What is the Global Wetlands Map?
The Global Wetlands Map is an interactive, web-based map showing global distribution of wetlands, histosols and carbon stocks. The map is based on satellite images using a Moderate Resolution Imaging Spectroradiometer, or MODIS. It covers tropical and subtropical regions up to 30 degrees North and 70 degrees South.
Monthly precipitation data was taken from the WorldClim global dataset, and evapotranspiration data was taken from the FAO-adopted monthly reference produced by the Climate Research Unit at the University of East Anglia. Topographic data was taken from the Shuttle Radar Topography Mission Digital Elevation Model prepared by CIAT, the International Center for Tropical Agriculture.
Using all this, we provide users with a kind of ‘snapshot’ of a particular period.
What do you mean by ‘wetlands’, ‘histosols’ and ‘carbon stocks’?
‘Wetlands’ in this context refers to areas that maintain a wet soil surface over a certain period of time. The level of wetness can range from permanently inundated, such as in the case of a water body, to an area that is periodically drained and rewetted.
‘Histosols’ are the peaty soils that tend to form in wetlands. By definition, they are more than 40 centimeters thick and are contain 20-30% organic matter by weight. Organic matter, such as plant and animal remains, decomposes slowly where water is present. So histosols are full of these organic materials and are important reservoirs of carbon.
‘Carbon stocks’ refers to the amount of carbon stored in various compartments in the ecosystem, including biomass above and below ground, in woody debris and litter, and in soil at a measurable depth. It is measured by tons per hectare.
By mapping wetlands and histosols, which are mainly carbon-rich systems, one can have a better estimate of carbon stocks in spatial terms. It’s helpful to put the numbers in spatial terms, instead of in tables or whatever, so that everybody can see right away the area that they are focusing on.
For example, if a particular country wants to see in more detail where its wetlands are, this data can easily be found by looking at the map. The IPCC [Intergovernmental Panel on Climate Change] recently published guidelines on how to conduct greenhouse gas inventories in wetlands, so countries with a huge amount of wetlands are now looking to define where those areas are and how to report them.
What’s the connection to climate change?
Knowing about carbon stocks in spatial terms will allow us to identify potential areas for climate change mitigation by conserving the existing carbon-rich pools and enhancing carbon sequestration and storage. The map is also a useful tool to locate and prioritize restoration activities, such as rewetting and revegetating, as measures for climate change adaptation.
Who do you think will be the main users of the map?
I don’t know what to expect from the users; they might be coming from many different schools of thought. They might not be soil scientists per se, or even interested in climate change. But if they are experts in their own right they can certainly contribute. Aside from hydrologists, soil scientists and climate change scientists, we may see other kinds of users such as land developers, infrastructure developers, conservationists and engineers.
Users can register with their existing Google account. All personal information will be treated as confidential, and will not be used for any purposes outside the Global Wetlands Map project.
The data used to make the map is available for free download by all users. This comes in a GeoTIFF format and can be used on geographic information systems programs such as ArcGIS to conduct further work.
Using the map itself, further research may be carried out to better understand carbon cycles and the factors affecting the process. Being able to easily contrast sites on the map will also help to transfer approaches from successful wetlands restoration initiatives to other parts of the world.


