By Michael Casey, originally published at CIFOR’s Forests News
One of the early successes in efforts to combat global warming has been a renewed push to tackle deforestation in some of the world’s last remaining tropical rainforests.
But, the Reducing Emissions from Deforestation and Forest Degradation (REDD) program – a UN effort to improve forest management in order to reduce greenhouse gas emissions – has suffered from a lack of dependable data to assist policy makers in quantifying how much biomass is present in the forests of Africa, Southeast Asia and Latin America.
There are several data sets available for countries looking to quantify their biomass and, in doing so, establish a baseline that would allow them to demonstrate they are making progress in reducing deforestation. However, because these maps depend heavily on satellite data, they have often been criticized as inadequate.
“The existing maps use satellite images to cover large areas, but the satellite images don’t actually see how much biomass there is,” said Valerio Avitabile, a postdoctoral researcher at the Center for Geo-Information at Wageningen University. Avitabile is currently working on a global comparative study on REDD+ being conducted by the Center for International Forestry Research (CIFOR), as part of the CGIAR Research Program on Forests, Trees and Agroforestry.
“They only see if there are forests and the characteristics of the forests. Biomass is indirectly related to the satellite images, so it requires a model to relate the ground data to the satellite data,” he said. “The satellites only see what is on top of the canopy, so that is why different models exist to estimate biomass from the satellite images.”
By combining two existing large-scale biomass maps that rely heavily on satellite data with information from approximately 14,000 plots on the ground, the authors believe they have a more accurate way to calculate forest biomass, especially as previous maps only used a few thousand plots in their models.
“Climate change is driven by the increase of carbon in the atmosphere. A large part of which comes from deforestation in the tropics,” said Avitabile. “In order to know how much carbon is being emitted, we need to know the rate of deforestation and how much biomass is in the forest.”
Starting from the bottom
Martin Herold, co-author of the paper from Wageningen University, said their map offers a “bottom-up approach” to quantifying biomass.
“Forest biomass can only be measured on the ground and satellite remote sensing can help to scale these up to provide large global maps,” he said. “One data source has the accuracy while the other provides the coverage. When you combine the two in a smart way, you get the best of both.”
Avitabile said the new map found that the total amounts of biomass were very similar to the rates quantified by the existing maps. Yet they discovered that earlier maps underestimated the amount of biomass in denser tropical forest and overestimated the amount in easier-to-access dry forests.
For countries like Indonesia and Brazil where a large percentage of emissions come from deforestation, those differences could prove critical. According to the REDD Desk, a project of the Global Canopy Programme, approximately 85 percent of Indonesia’s emissions come from land use – including 37 percent from deforestation.
REDD ready
More accurate data could help the more than 50 countries that want to take part in REDD in order to develop more credible national inventories of their carbon stocks. In exchange for protecting their forests, the idea is that these countries will be able to obtain financing from richer nations.
“Countries would ideally do a national forest carbon inventory for their carbon stock estimations,” Herold said. “In cases where this is not available, or there is only limited ground data, one could use the local and national data and then re-calibrate the available large-area map data for regional and national circumstances.”
Improved maps could also help the countries better understand the consequences of where exactly deforestation is happening so they can better monitor their scarce resources.
“Since most deforestation is occurring in dense, humid forests like the Amazon, or in Borneo, the emissions are higher than those estimated from previous maps,” Avitabile said.
“It matters because it helps to better quantify the emissions from deforestation, which are directly related to the amount of biomass in the forest,” he continued. “If dense humid areas are deforested, the emissions will be higher than in dry forest.”
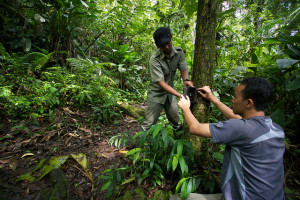
Avitabile acknowledged that his approach does present challenges, partly because acquiring ground data is costlier than relying on satellite data and it can be time-consuming because tropical forest access can be difficult.
Still, he believes his map is an improvement on what is available. In addition, the project is part of a growing push for better maps in the years to come – especially as the National Aeronautics and Space Administration (NASA) and the European Space Agency launch satellites aimed at quantifying forest biomass.
“There are two parts to the problem: one is to show what is happening with deforestation and the other is to show how much biomass is in the forest,” he said. “I’m working on solving the second part of the problem.”
“To move forward, we need more ground data and better integration with remote sensing data,” he said. “So work remains to be done.”